You are working with a real estate analytics team that helps housing agencies and government planners understand how different factors affect property prices across California. Using data from the 1990 California Census, your task is to build a Linear Regression model that predicts the median house value in a given census block, based on numerical features such as median income, housing age, total rooms, population, and more.
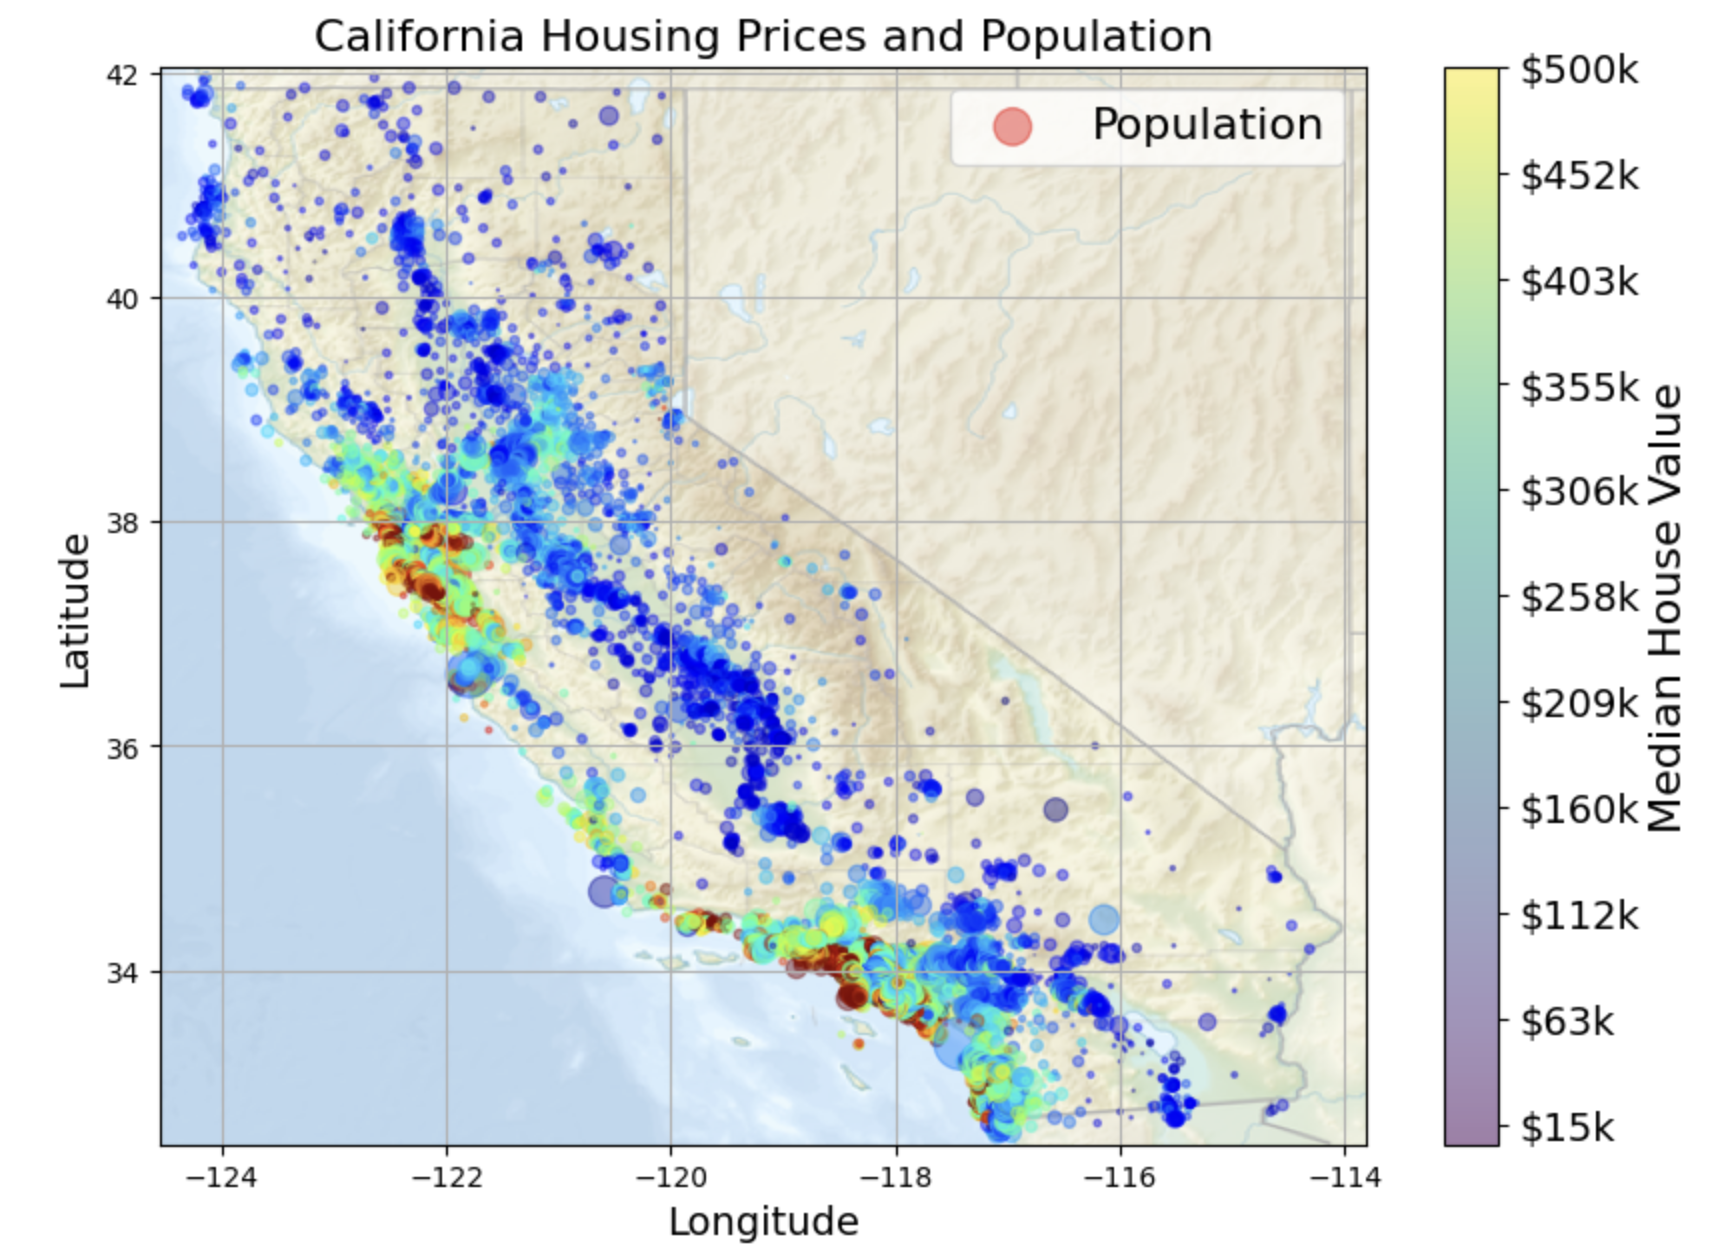
The dataset includes over 20,000 records and covers diverse regions including areas near the ocean, bay, and inland zones. The model will serve as a simple, interpretable tool to estimate housing prices and identify the most influential factors driving them.

In this project, we built a Linear Regression model to predict median house values across California using data from the 1990 Census. The model was trained on key numeric and categorical features, including median income, housing age, population, and proximity to the ocean.
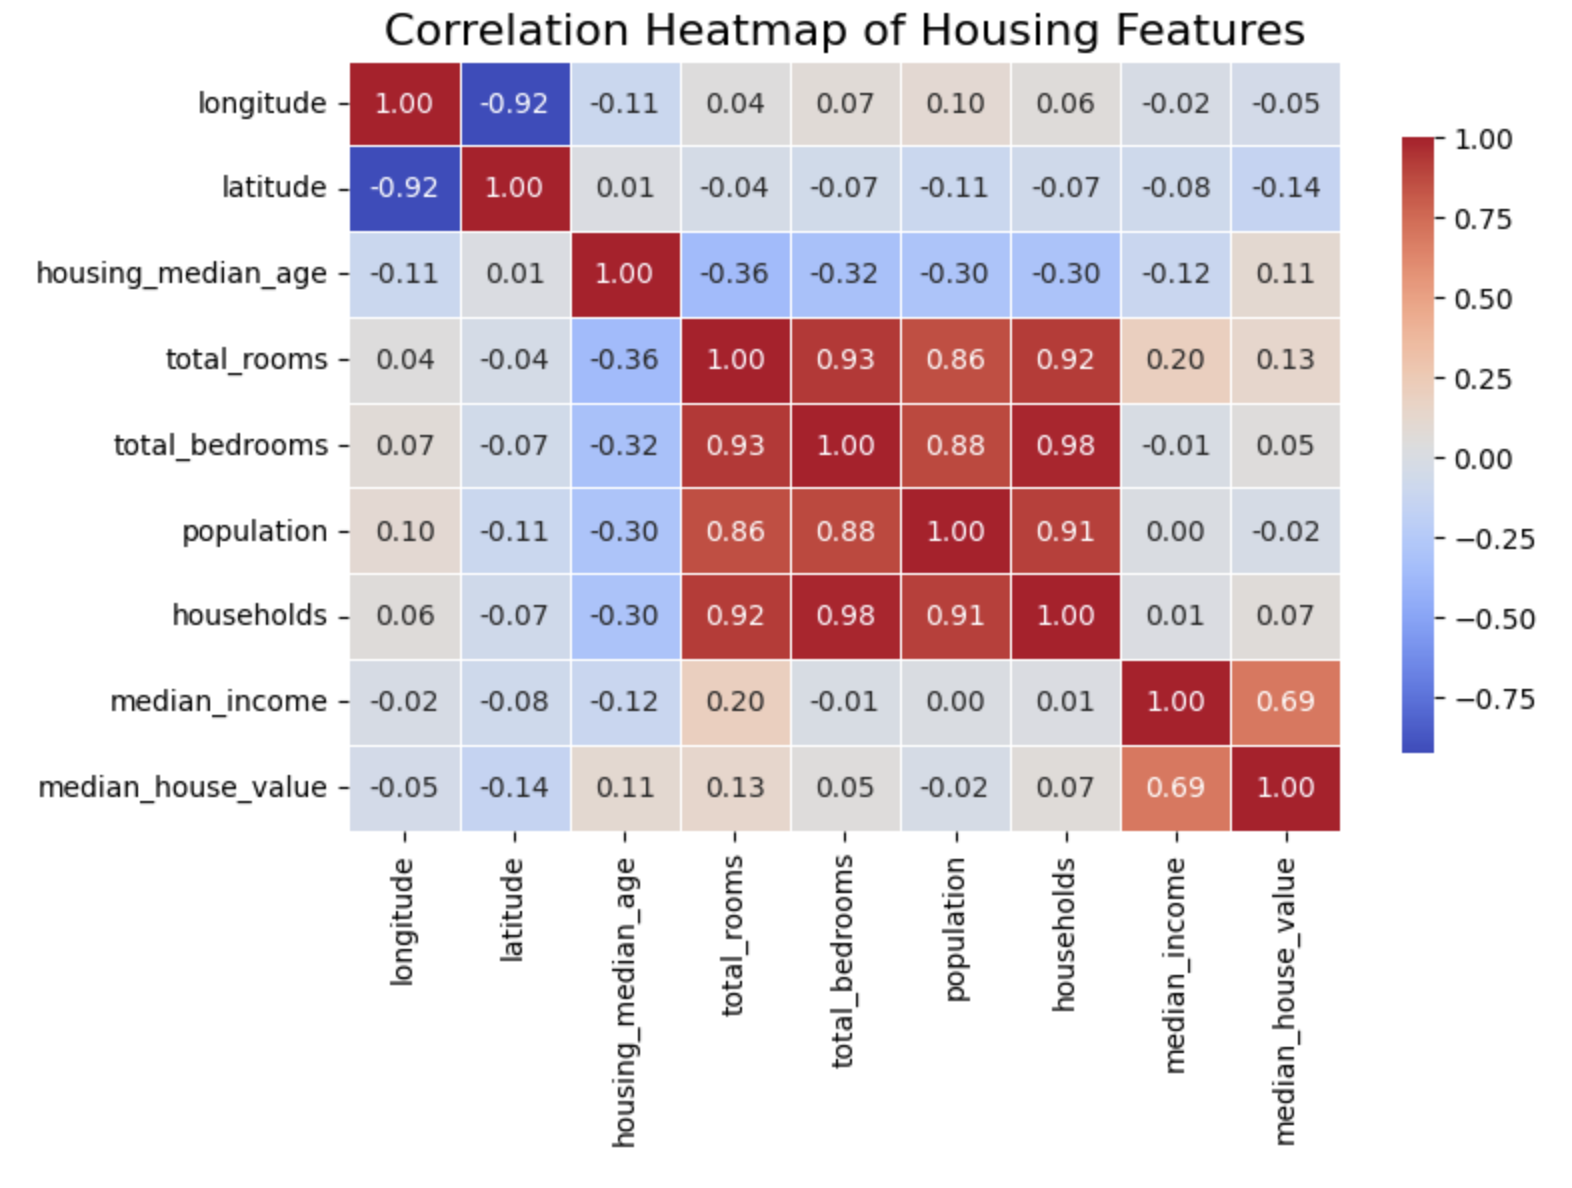
These metrics suggest that, on average, our predictions deviate from actual house values by around $44,000, and the model explains about 61.5% of the variance in housing prices. While the model captures general trends (especially the strong correlation between income and price), the relatively high error values indicate that housing prices are influenced by non-linear relationships and complex interactions not fully captured by a simple linear model.
Linear regression provided a simple and interpretable baseline, helping identify influential features like median_income. However, to achieve more accurate predictions, especially in areas with extreme property values or unique geographic characteristics, more advanced models like Random Forests or Gradient Boosting could be explored in future iterations.